
Running a task
Transitioning from measurements to tasks
QruiseOS fills the gap between a measurement and a task. Let us briefly explain why we make a clear distinction between these two concepts. When running a measurement, the measurement instance holds the code to run on a QPU but does not include any analysis or data persistence methods. In contrast, a Task contains the instructions for submission, analysis, and data persistence in a single notebook that is executed cell by cell. It also defines input parameters that can be set externally, making it easy to run the notebook as part of a larger workflow.
A measurement defines the code to run on a QPU, while a task consists of a notebook carrying out the measurement and data persistence. In other words, the task notebook holds the logic of setting QPU and measurement configuration, running the measurement, carrying out the analysis of the measurement, and persisting the measurement and analysis data. Crucially, a task provides the relevant context and specifies what to do with the new data.
This distinction clarifies that they are two well-separated codebases:
-
The measurement code itself, which:
- provides the definition of actual commands/circuits sent to the QPU
- is QPU specific
- is the responsibility of the user
-
The QruiseOS software and its assets, which:
- are Qruise's responsibility
- enable access to the (latest) analysis output and QPU configuration
- enable persistence of the data from measurements and analysis
The concept of tasks integrates these two elements into a user-friendly experience, with Qruise providing an architecture and templates to swiftly go from user-defined measurements to tasks. Tasks encapsulate all the needed context beyond the mere measurement and can then be orchestrated into workflows.
As we have just seen, transitioning from measurements to tasks is absolutely necessary to enable a mature QPU user platform. This is what QruiseOS provides.
Architecture choices explained: why are tasks notebooks?
This design produces a manageable, self-contained unit that enables reproducibility and orchestration into larger workflows. Notebooks also provide experimentalists with flexibility and instant set-up.
To learn what a Task is, you should first go through tutorial Running a single task. The purpose of this tutorial is to explain how a task helps in consolidating measurement, analysis, plotting, and data persistence in a single notebook.
Tasks as QPU experiments or numerical simulations
Tasks don't necessarily involve a measurement on a QPU. For example, a notebook carrying out an optimal control algorithm to define a new set of robust gates based on current QPU knowledge can be handled as a task and performed alongside experiments tasks in a single workflow.
Structure of an experiment task
QruiseOS allows for a lot of flexibility in how a task notebook can be structured. In this section, however, we provide a typical template for structuring an experiment task.
The dashboard Experiment Database provides examples of tasks to look into. We suggest to select a T1 experiment run on the my-new-qpu chip and click "Open" to see the task notebook as it was executed. Here is for convenience a snapshot of the second part of the notebook.
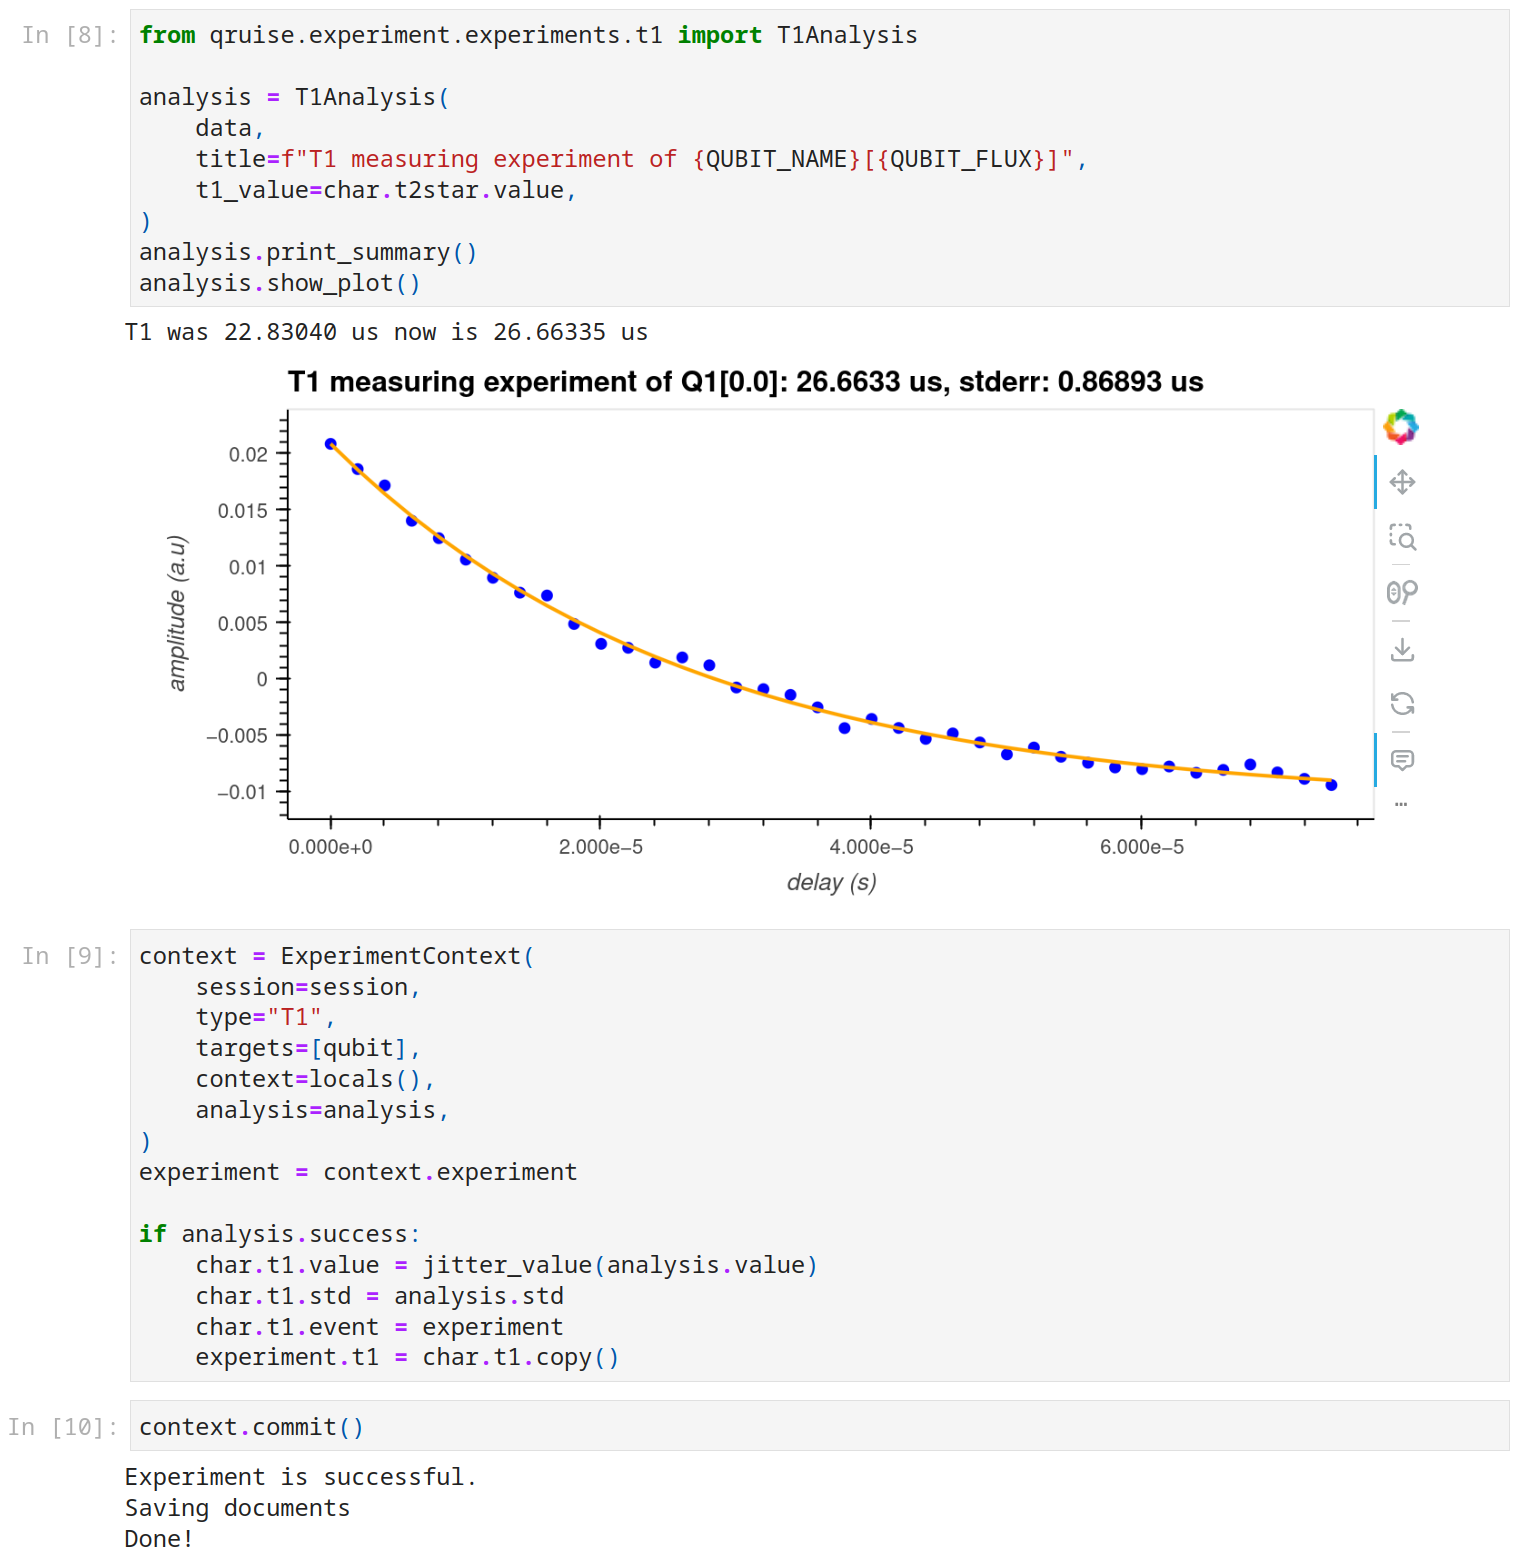
These notebook cells come right after having acquired the data with the measurement(qpu,QUBIT_NAME).measure() command. In the case of this notebook, the measurement is completed with an analysis with visualisation of the fit (note that the plot is picked up by the Experiment Viewer for a quick view into experiment output). Finally, the last two cells take care of data persistency.
Custom analysis catalogue
Like in the case of measurements, even though Qruise has developed an extensive analysis catalogue for a whole breadth of experiments, we expect QruiseOS users to also want to use their own in-house catalogue. With QruiseOS architecture, doing so is only a matter of adding this line to utils.py:
Of course, yourlab.experiments has to be prepared so that it embraces the QruiseOS way to describe experiment analysis. Qruise provides templates to streamline the whole process.