Running a task
When running a measurement, the measurement instance holds the code to run on a QPU but does not hold methods for anaylsis or data persistence.
In contrast, a Task consists of a notebook that is meant be executed from top to bottom and cell by cell. It also provides some input parameters exposed for the purpose of orchestration of tasks into a workflow.
The architecture choices explained: why tasks are notebooks?
The benefit of this design is to have a manageable and self-contained unit that enables reproducibility and orchestration into workflows. Notebooks also provide flexibility and instant set up to experimentalists.
In order to learn hands-on what a Task is, you should first go through tutorial 01_overview_single_measurement in your Jupyter instance and run the corresponding notebook. The purpose of this tutorial is to explain how a task helps in consolidating measurement, analysis, plotting, and data persistence in a single notebook.
Tasks can be experiment on the QPU chip or numerical simulation
Tasks do not necessarily involve a measurement on a QPU. For example, a notebook carrying out an optimal control algorithm based on current QPU knowledge to define a new set of robust gates can be handled as task. It can then be orchestrated alongside experiment tasks.
Structure of an experiment task
QruiseOS allows for a lot of flexibility in the way a task notebook can be structured. Nonetheless, we now provide some guidelines by describing the typical template for the special case of experiment tasks.
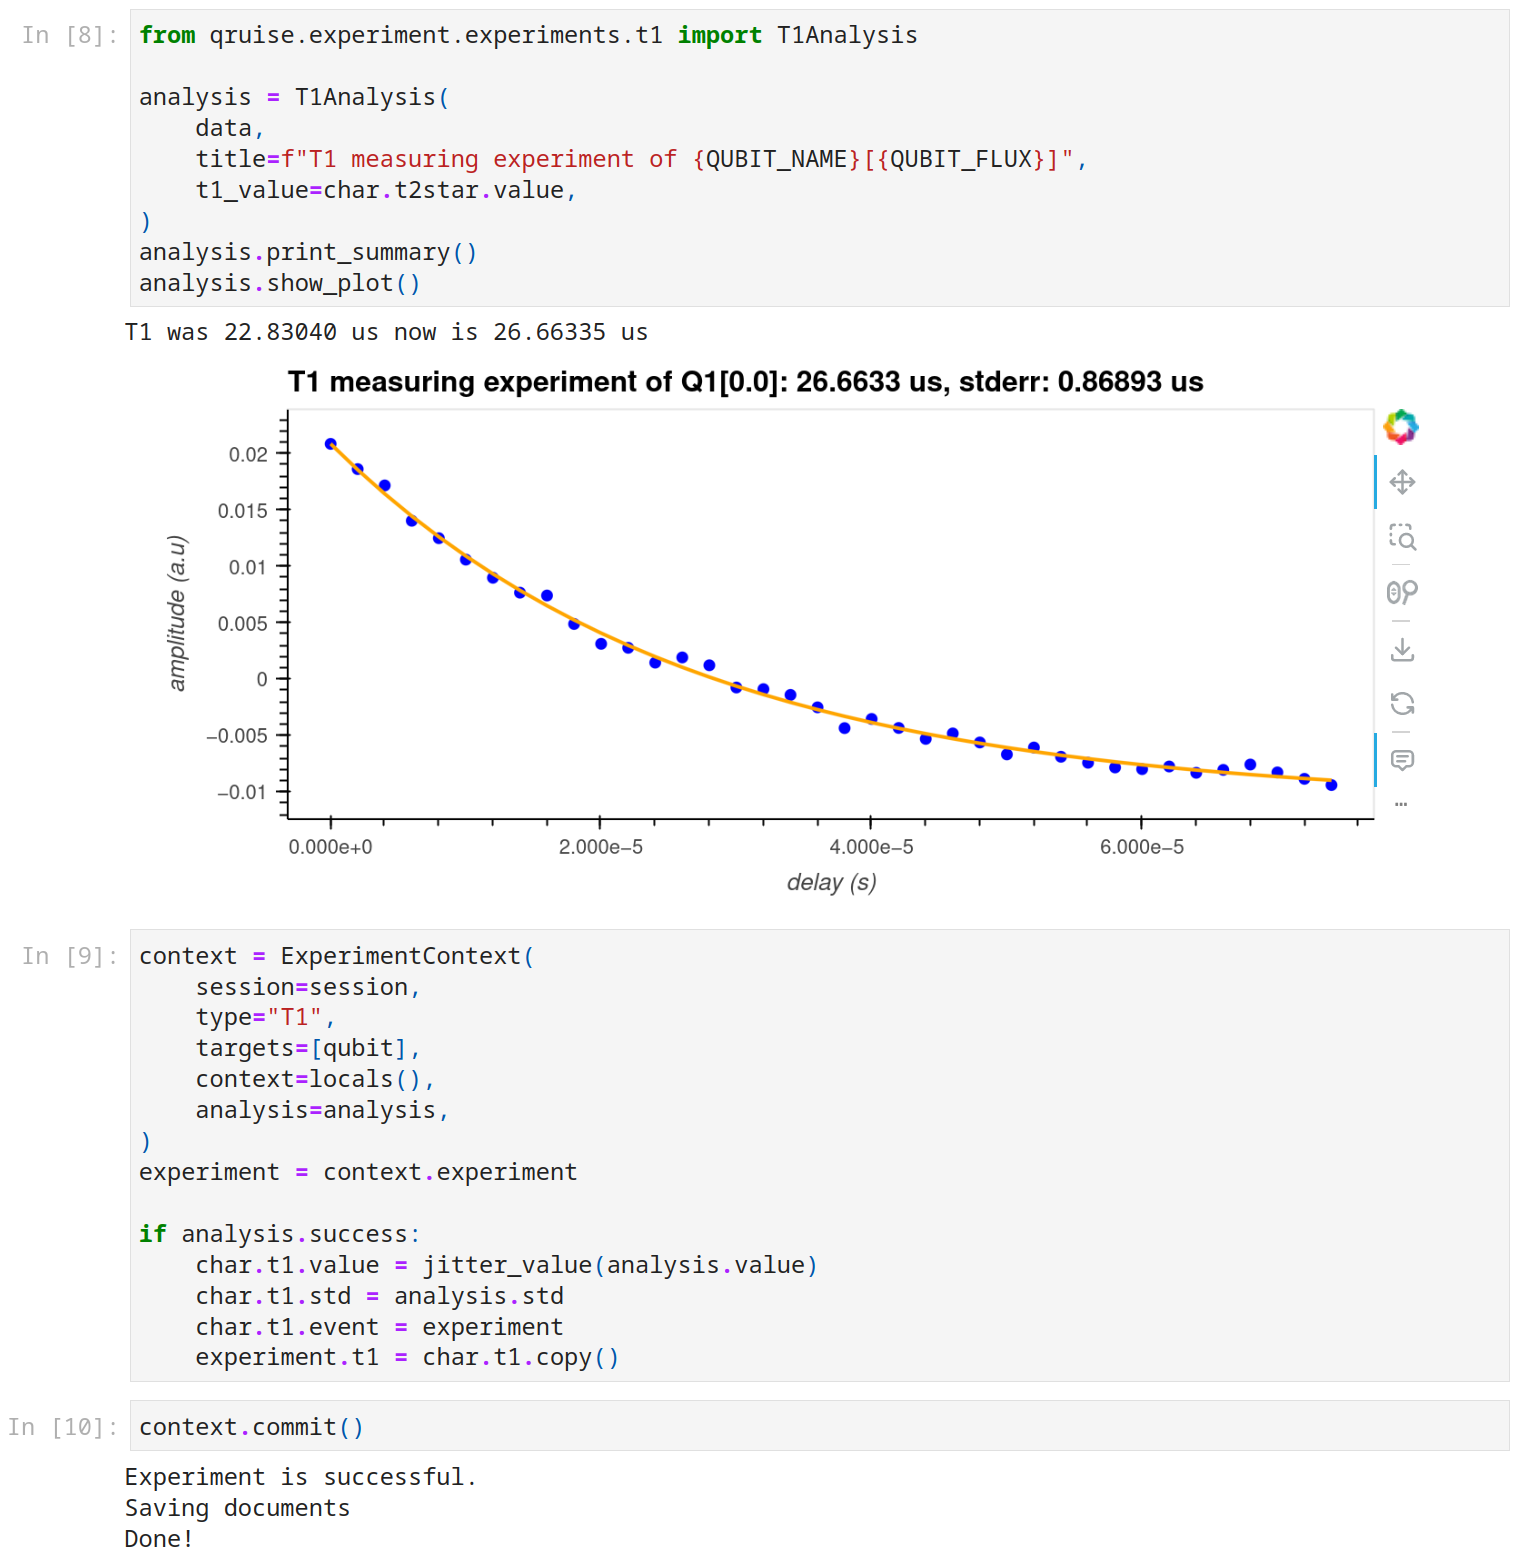
The dashboard Experiment Viewer provides examples of tasks to look into. We suggest to select a T1 experiment run on the my-new-qpu chip and click "Open" to see the task notebook as it was executed. Here is for convenience a snapshot of the second part of the notebook.

These notebook cells come right after having acquired the data with the measurement(qpu,QUBIT_NAME).measure() command. In the case of this notebook, the measurement is completed with an analysis with visualisation of the fit (note that the plot is picked up by the Experiment Viewer for a quick view into experiment output). Finally, the last two cells take care of data persistency.
Custom analysis catalogue
Like in the case of measurements, even though Qruise has developed an extensive analysis catalogue for a whole breadth of experiments, we expect QruiseOS users to also want to use their own in-house catalogue. With QruiseOS architecture, doing so is only a matter of adding this line to utils.py:
Of course, yourlab.experiments has to be prepared so that it embraces the QruiseOS way to describe experiment analysis. Qruise provides templates to streamline the whole process.