Readout discriminator training (0-1-2 states)
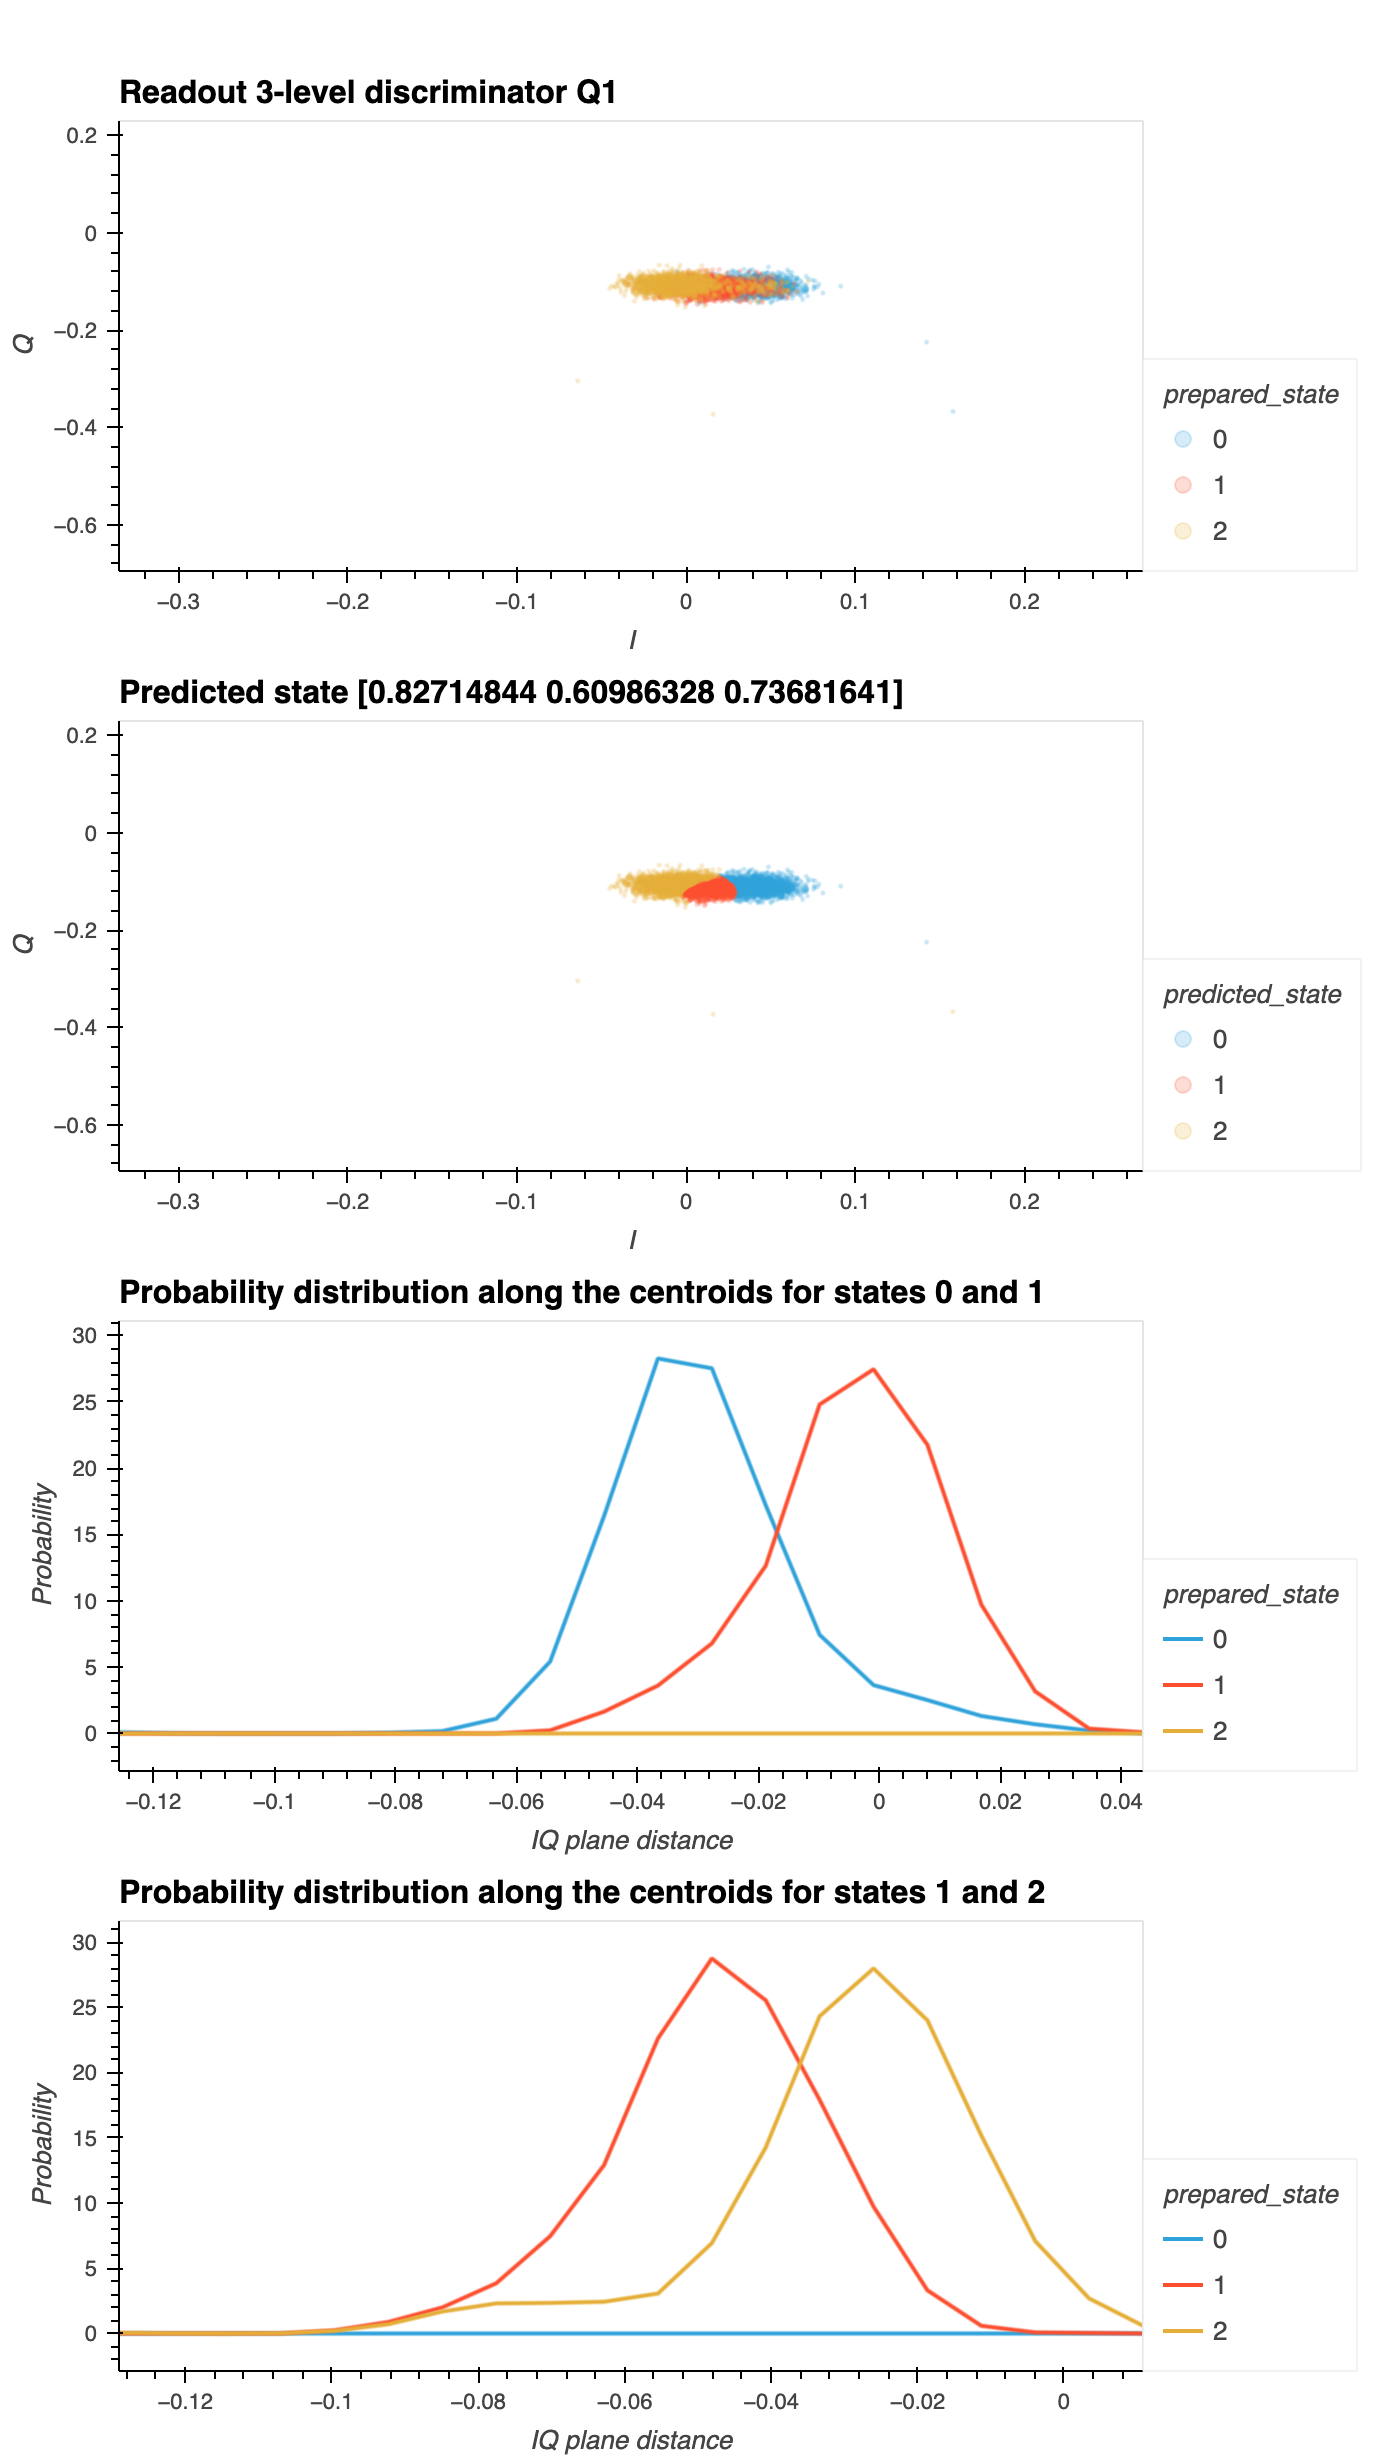
This notebook trains a 0-1-2 discriminator
Description
The experiment measures the \(I\) and \(Q\) signals when
the qubit is prepared in the ground state \(|g\rangle\), first excited
state \(|e\rangle\), and second excited state \(|f\rangle\) (i.e., 0-1-2
states). Given the collected data, the discriminator fits using
sklearn LDA (Linear Discriminant Analysis) or QDA (Quadratic
Discriminant Analysis). LDA and QDA are two well-known supervised
classification methods in statistical and probabilistic learning1.
Without going into
further details, given a dataset of instances
\(\{(\textbf{x}_{i}, y_{i})\}^{n}_{i=1}\) with a sample size of \(n\) and
dimensionality \(x{i} \in \mathbb{R}_{d}\) and \(y_{i} \in \mathbb{R}\),
with \(y_{i}\) as the class labels, LDA and QDA can be used to classify
the data space using these instances.
Experiment steps
-
Measuring the resonator transmission and collecting the \(I\) and \(Q\) signals when the qubit is in \(|g\rangle\).
-
Applying a \(\pi\)-pulse (
rx180), which prepares the qubit in the excited state \(|e\rangle\). -
Measuring the resonator transmission and collecting the \(I\) and \(Q\) signals when the qubit is in \(|e\rangle\).
-
Applying a second \(\pi\)-pulse (
rx180_ef), which prepares the qubit in the second excited state \(|f\rangle\). Note that the \(\pi\)-amplitude is represented asef_x180_amplitude. -
Measuring the resonator transmission and collecting the \(I\) and \(Q\) signals when the qubit is in \(|f\rangle\).
Analysis steps
-
Training the discriminator using LDA (or QDA), thus obtaining the conditional probability \(\text{P}(\text{state}_\text{measured}|\\ \text{state}_\text{prepared})\) for each state.
-
Compute the Probability Distribution Function for each measured state along the axis that connects the centers of the \(I\)-\(Q\) cluster data. The axes are computed using pairs of adjacent centers. In this notebook, we compute two axes: one connecting the centers of the \(I\)-\(Q\) data for \(|g\rangle\) and \(|e\rangle\) states (named
x_01), and a second connecting the centers of the \(I\)-\(Q\) data for \(|e\rangle\) and \(|f\rangle\) states (namedx_12).
-
Benyamin Ghojogh and Mark Crowley. Linear and quadratic discriminant analysis: tutorial. 2019. arXiv:1906.02590. ↩
